|
|
Order by Related
- New Release
- Rate
Results in Title For visualization
Results in Keywords For visualization
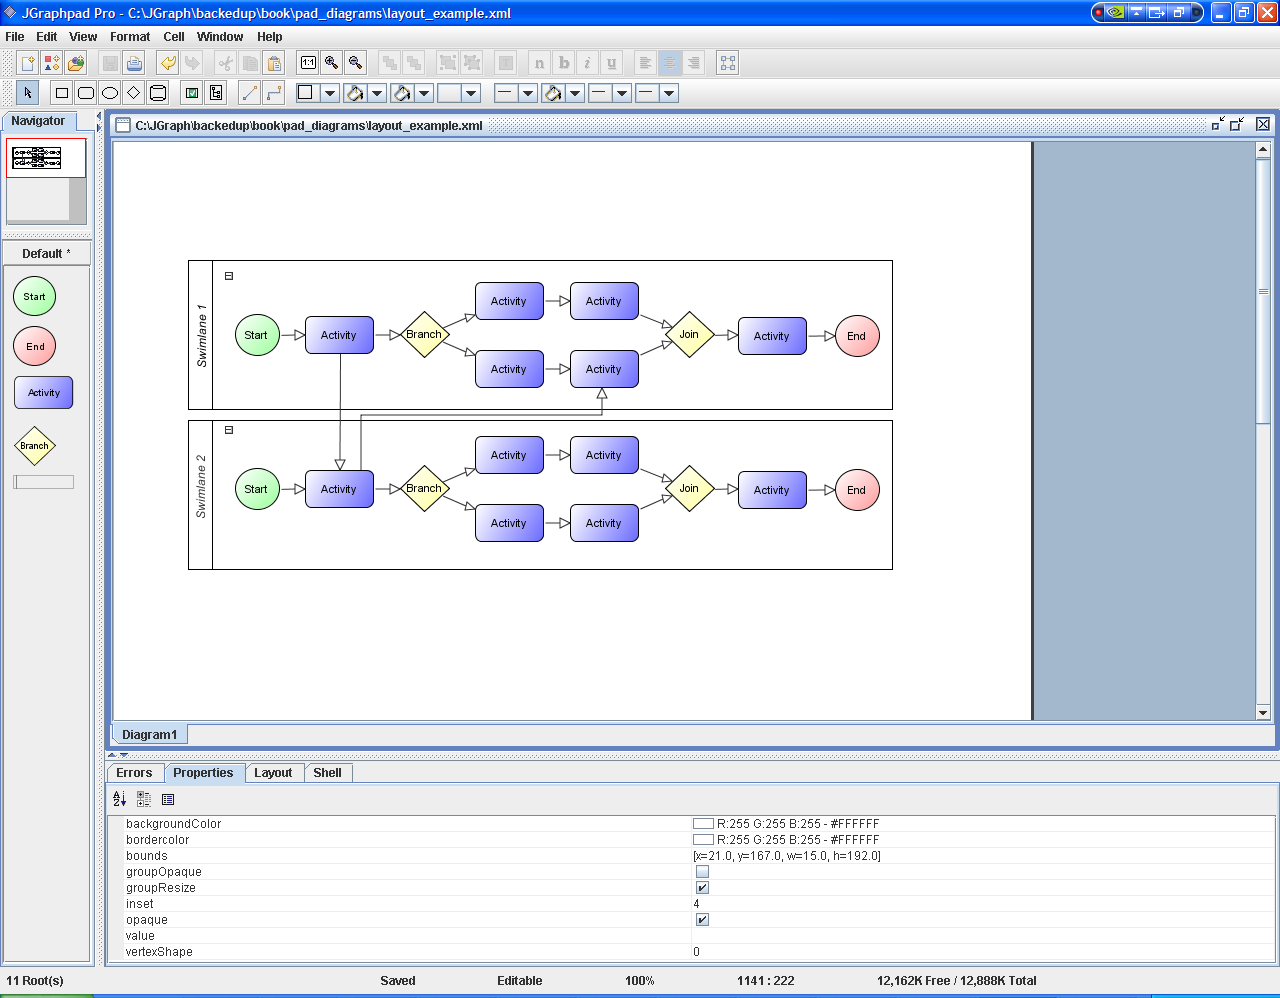 | JGraph is the leading Open Source Java Graph Visualization Library. It follows Swing design patterns to provide an API familiar to Swing programmers and functionality that provides a range of features. Graph visualization is a central requirement for applications such as workflow editors, computer and telecommunication networks display, flowcharts, VLSI and CAD, business process modeling, organizational charts, entity-relationship and cause and effect diagrams, and much more.
The core JGraph library provides all the features required in a graph visualization library. Built on top of the core are JGraph Layout Pro and JGraphpad Pro. JGraph Layout Pro provides graph layouts that automatically position your nodes. There is a hierarchical layout for workflows, tree layouts for organization charts and so on. JGraphpad Pro is a complete application framework that enables you to rapidly prototype your application, dramatically reducing your time to market for your product... |
|
 | UCanCode provides a complete set of services, consisting of design tools and a software development kit (SDK), for developers who want to create a user interface for industrial monitoring and process control drawing SCADA applications...
|
|
 | UCanCode BPM C++ Extension Library with 100% BPM and workflow features, build Advanced Diagrams and Dashboards for Business Process Management (BPM) in minutes.. |
|
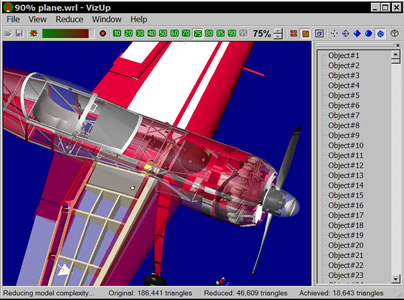 | Models that you create with the help of 3D modeling tools, as well as models converted from CAD software can be extremely complex. These models may consist of many hundreds of thousands of polygons and be practically impossible to process in real-time visualization.
VizUp Professional has the basic set of functionalities. It enables you to reduce the number of polygons in a complex 3D model while retaining the quality and appearance of the original. The end result of the reduction is a 3D model with a well-balanced level of details and size, which is perfect for the use in virtual reality and real-time visualization systems. The process of reduction is extremely simple and doesn..
|
|
 | UCanCode Software Inc. is a premier provider of Dynamic Graphics, Data Visualization, Human-Machine Interface (HMI) and Real-Time Mapping Solutions for software developers around the world... |
|
 | VizUp Streamline Professional enables you to reduce the number of polygons in a complex 3D model while retaining the quality and appearance of the original. Supports Wavefront .OBJ, VRML 2.0/97 and StereoLitho (.STL) file formats...
|
|
 | Internet-ready, real-time 3D software from Bitmanagement will progressively penetrate traditional industries and consumer markets... |
|
 | Electronic paper product catalog software with page visualization and database. Uses existing catalogs in DTP or PDF on PC and/or Internet. Automatically connects article numbers on pages with database. Comes with comprehensive ordering system... |
|
 | Build your own Multisim like circuit design and simulation application!
Diagrams are a natural and intuitive way of expressing relationships in your application data. E-XD++ Components make it easy to add expressive, interactive Circuit Design.. |
|
 | Chess Vision Trainer is a chess training system to improve your visualization and move calculation skills in Chess. Visualization and calculation plays a major role in chess. These are the skills that separates the masters from the amateurs.
When Alekhine was asked "How many moves do you see ahead?" his answer was "Just one move deeper than my opponent!".
The built-in chess playing engine is your training partner. The position displayed on the chess board is not the true position but the position a certain number of half-moves prior to the true position. You do not decide the moves based on the displayed position but based on the true position (which you do not see but you're trying to visualize). This means that you are always forced to look ahead of the chess position you see on the board.
Then, there is the concept of 'Blindfold Areas'. Blindfold Areas are quadrants of the chess board and these are areas where the pieces are invisible. One of the intentions of this concept is to solve the problem of 'blind spots'. Using the concept of Blindfold Areas will also help you to develop chess board memory. This idea of dividing the chess board into quadrants for the purpose of visualization is derived from Buckley's suggestion in his book Practical Chess Analysis.
The combination of these training exercises will improve your visualization and move calculation skills... |
|
Results in Description For visualization
| JGraph is the leading Open Source Java Graph Visualization Library. It follows Swing design patterns to provide an API familiar to Swing programmers and functionality that provides a range of features. Graph visualization is a central requirement for applications such as workflow editors, computer and telecommunication networks display, flowcharts, VLSI and CAD, business process modeling, organizational charts, entity-relationship and cause and effect diagrams, and much more.
The core JGraph library provides all the features required in a graph visualization library. Built on top of the core are JGraph Layout Pro and JGraphpad Pro. JGraph Layout Pro provides graph layouts that automatically position your nodes. There is a hierarchical layout for workflows, tree layouts for organization charts and so on. JGraphpad Pro is a complete application framework that enables you to rapidly prototype your application, dramatically reducing your time to market for your product... |
|
| Chess Vision Trainer is a chess training system to improve your visualization and move calculation skills in Chess. Visualization and calculation plays a major role in chess. These are the skills that separates the masters from the amateurs.
When Alekhine was asked "How many moves do you see ahead?" his answer was "Just one move deeper than my opponent!".
The built-in chess playing engine is your training partner. The position displayed on the chess board is not the true position but the position a certain number of half-moves prior to the true position. You do not decide the moves based on the displayed position but based on the true position (which you do not see but you're trying to visualize). This means that you are always forced to look ahead of the chess position you see on the board.
Then, there is the concept of 'Blindfold Areas'. Blindfold Areas are quadrants of the chess board and these are areas where the pieces are invisible. One of the intentions of this concept is to solve the problem of 'blind spots'. Using the concept of Blindfold Areas will also help you to develop chess board memory. This idea of dividing the chess board into quadrants for the purpose of visualization is derived from Buckley's suggestion in his book Practical Chess Analysis.
The combination of these training exercises will improve your visualization and move calculation skills...
|
|
| Models that you create with the help of 3D modeling tools, as well as models converted from CAD software can be extremely complex. These models may consist of many hundreds of thousands of polygons and be practically impossible to process in real-time visualization.
VizUp Professional has the basic set of functionalities. It enables you to reduce the number of polygons in a complex 3D model while retaining the quality and appearance of the original. The end result of the reduction is a 3D model with a well-balanced level of details and size, which is perfect for the use in virtual reality and real-time visualization systems. The process of reduction is extremely simple and doesn.. |
|
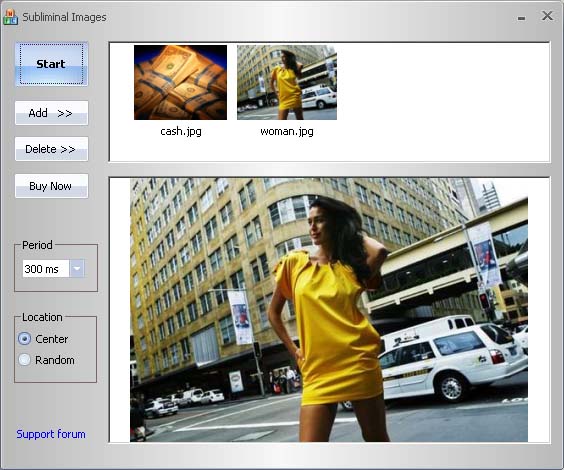 | Dream Board is a program for visualization (do you remember "The Secret"?). This program helps you to create subliminal dream boards. You can add any graphic files to it to start visualization. Exposure time of each image is extremely low, the effect is called subliminal messaging, and images are being imprinted into your subconscious mind, making it believe in your dream and therefore the Law of Attraction starts working making positive changes in your life. You can attract money, carrier, love, charisma, health, self-confidence and much more. Visualisation is a really powerful technique and computer helps you maximize the power of your vision board. To find more information about the Dream Board program and about the law of attraction, visit our home page at http://www.preduprejdaet.com..
|
|
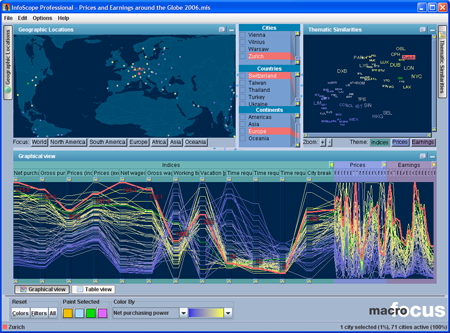 | InfoScope is an interactive visualization tool to access, explore, and communicate large or complex datasets... |
|
 | Many of the models that you create with the help of 3D modeling tools, as well as some models converted from CAD software can be very complex. These models may consist of hundreds of thousands, even millions of polygons and are practically useless for processing in real-time visualization systems.VizUp is an easy-to-use tool for reducing and optimizing 3D models. With the help of VizUp, you can reach the optimal balance between the necessary details level and the size of 3D models. You can also use this software to reduce the number of polygons for your 3D models used in virtual reality and real-time visualization systems. Decreasing the size of 3D models stored on the Web lets your users and customers download them much faster. Besides, this product can also be effectively used for Level-of-Details (LOD) generation. ..
|
|
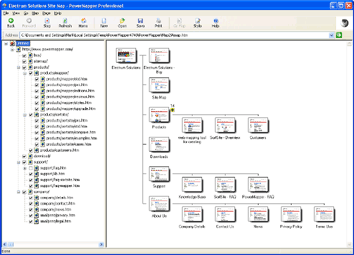 | PowerMapper allows information architects, usability analysts and web developers to create graphical site maps with one click, providing site visualization and simple navigation. Maps show thumbnails of web pages and can be tailored using 7 different styles then printed or copied into another application.
Key Features:
Mapping - create maps of any site on the World Wide Web or your own intranet
Customization - modify maps to match your needs with 7 different map styles
Printing - print out the top 3 levels of your site
Export - export maps to Excel CSV or Google sitemap format
Validation - find pages with invalid HTML or broken links
Visualization - check consistency of site structure and graphic design from one simple view.. |
|
 | Visualization and Reproduction of colors is problematical at its best.ColorChart provides custom tailored solutions for professionals - with Automatic RGB and hexadecimal encoding . This is best suited for stitching, needlework and .. |
|
| This chess game can be played as a stand-alone game, over the Internet or on a network. It provides 3D visualization of pieces and moves... |
|
| Visualization and Reproduction of colors is problematical at its best.ColorChart provides custom tailored solutions for professionals - with Automatic RGB and hexadecimal encoding . This is best suited for fashion world color .. |
|
Results in Tags For visualization
| VizUp Streamline Professional enables you to reduce the number of polygons in a complex 3D model while retaining the quality and appearance of the original. Supports Wavefront .OBJ, VRML 2.0/97 and StereoLitho (.STL) file formats... |
|
| Models that you create with the help of 3D modeling tools, as well as models converted from CAD software can be extremely complex. These models may consist of many hundreds of thousands of polygons and be practically impossible to process in real-time visualization.
VizUp Professional has the basic set of functionalities. It enables you to reduce the number of polygons in a complex 3D model while retaining the quality and appearance of the original. The end result of the reduction is a 3D model with a well-balanced level of details and size, which is perfect for the use in virtual reality and real-time visualization systems. The process of reduction is extremely simple and doesn..
|
|
| JGraph is the leading Open Source Java Graph Visualization Library. It follows Swing design patterns to provide an API familiar to Swing programmers and functionality that provides a range of features. Graph visualization is a central requirement for applications such as workflow editors, computer and telecommunication networks display, flowcharts, VLSI and CAD, business process modeling, organizational charts, entity-relationship and cause and effect diagrams, and much more.
The core JGraph library provides all the features required in a graph visualization library. Built on top of the core are JGraph Layout Pro and JGraphpad Pro. JGraph Layout Pro provides graph layouts that automatically position your nodes. There is a hierarchical layout for workflows, tree layouts for organization charts and so on. JGraphpad Pro is a complete application framework that enables you to rapidly prototype your application, dramatically reducing your time to market for your product... |
|
| InfoScope is an interactive visualization tool to access, explore, and communicate large or complex datasets...
|
|
| Chess Vision Trainer is a chess training system to improve your visualization and move calculation skills in Chess. Visualization and calculation plays a major role in chess. These are the skills that separates the masters from the amateurs.
When Alekhine was asked "How many moves do you see ahead?" his answer was "Just one move deeper than my opponent!".
The built-in chess playing engine is your training partner. The position displayed on the chess board is not the true position but the position a certain number of half-moves prior to the true position. You do not decide the moves based on the displayed position but based on the true position (which you do not see but you're trying to visualize). This means that you are always forced to look ahead of the chess position you see on the board.
Then, there is the concept of 'Blindfold Areas'. Blindfold Areas are quadrants of the chess board and these are areas where the pieces are invisible. One of the intentions of this concept is to solve the problem of 'blind spots'. Using the concept of Blindfold Areas will also help you to develop chess board memory. This idea of dividing the chess board into quadrants for the purpose of visualization is derived from Buckley's suggestion in his book Practical Chess Analysis.
The combination of these training exercises will improve your visualization and move calculation skills... |
|
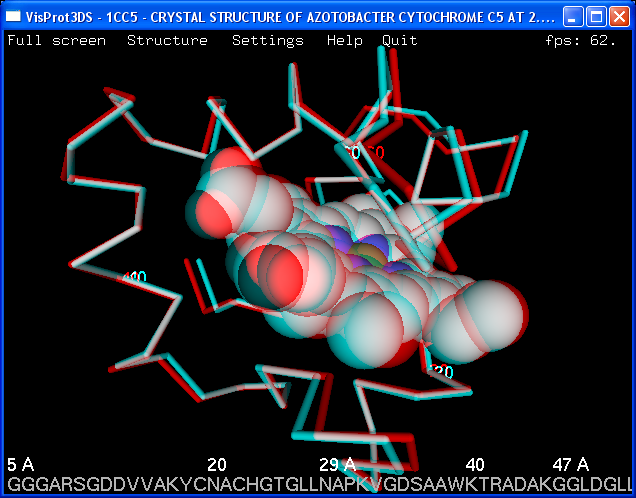 | Look at the Proteins in stereo without any glasses. Using VisProt3DS some people can do it. You can use VisProt3DS to look at the Proteins and DNA in stereo for the scientific goals, education purposes, as a hobby, with curiosity or simply for a fun...
|
|
 | VizUp Streamline is designed for optimization of complex 3D models (CAD/CAE systems) for real-time visualization. Supports Wavefront .OBJ, VRML 2.0/97 and StereoLitho (.STL) file formats... |
|
| Internet-ready, real-time 3D software from Bitmanagement will progressively penetrate traditional industries and consumer markets... |
|
| Optimal Pilot is designed for optimization of complex 3D models (CAD/CAM/CAE systems and others) for real-time visualization. This 3D reduction and optimization tool will speed rendering and provides enhanced control over a 3D model's visual quality... |
|
| UCanCode provides a complete set of services, consisting of design tools and a software development kit (SDK), for developers who want to create a user interface for industrial monitoring and process control drawing SCADA applications... |
|
Related search : izup professionaltime visualizationreal time,real time visualizationtime visualization systemsgraph visualization,graph visualization library,chess boardtrue positionblindfold areasvisualization andvision trainerchess vision,chess vision trainerimproOrder by Related
- New Release
- Rate
audio visualization -
visualization plug_in -
information visualization -
storage visualization -
winamp visualization -
|
|