|
|
Order by Related
- New Release
- Rate
Results in Keywords For debugging
 | Exception Wizard is a debugging tool for programmers, created to assist in the debugging of 32-bit Windows applications created with MS VC++ 6.0. Exception Wizard takes an exception address and a project map file and automatically determines where in the source code the exception occurred. Exception Wizard is especially helpful in the following situations: release mode exceptions that cannot be reproduced in debug mode, crashes reported by users (where debugging is not available), and large projects with prohibitively long debug load times. .. |
|
 | Team Remote ASP Debugger is an award-winning ASP debugging tool that enables your team to easily edit and debug ASP code remotely and locally, directly on your production server. JavaScript debugging and VBScript debugging is fully supported for simple and complex local, remote and team remote debugging scenarios.
Now Featuring dockable floating windows, and an intagrated interactive step by step ASP debugging guide.
Team Remote ASP Debugger enables you to:
Debug VBScript error in ASP code,
Debug JavaScript (jscript) error in ASP code,
Expression Evaluation,
Set Breakpoints in ASP,
Step in / out / over,
Variable Watch,
Advanced "GET" and "POST" form debugging
and more..
|
|
 | SplineTech JavaScript HTML Debugger is a unique award-winning javascript debugging tool that enables you to easily edit and debug JavaScript and VBScript inside HTML pages. Client-Side JavaScript, JScript and VBScript debugging languages are fully supported for simple and complex HTML and DHTML debugging scenarios.Now Featuring dockable floating windows, and an intagrated interactive step by step javascript debugging guide. Latest feature added - Local variable Watch tree... |
|
 | SplineTech JavaScript Debugger PRO is an award-winning javascript debugging tool that enables you to easily edit and debug JavaScript and VBScript inside HTML pages. Client-Side JavaScript, JScript and VBScript debugging languages are fully supported for simple and complex HTML and DHTML debugging scenarios.Now Featuring dockable floating windows, and an integrated interactive step by step javascript debugging guide. Latest feature added - Local variable Watch tree...
|
|
 | SplineTech JavaScript HTML Debugger is a unique web development tool that enables you to easily edit and debug JavaScript and VBScript inside HTML pages. Client-Side JavaScript, JScript and VBScript debugging languages are fully supported for simple and complex HTML and DHTML debugging scenarios.Now Featuring dockable floating windows, and an intagrated interactive step by step javascript debugging guide. Latest feature added - Local variable Watch tree... |
|
 | OptiPerl will help you make CGI scripts in Perl, offline in Windows. It is a fully integrated visual environment and editor for creating, testing, debugging and running perl scripts, directly or through associated html documents. Includes many tools...
|
|
| A complete data structures/collection classes library, memory tracing, memory debugging, entry/exit tracing, exception handling, definable memory handlers, built-in threads support and much more... |
|
Results in Description For debugging
| SplineTech JavaScript Debugger PRO is an award-winning javascript debugging tool that enables you to easily edit and debug JavaScript and VBScript inside HTML pages. Client-Side JavaScript, JScript and VBScript debugging languages are fully supported for simple and complex HTML and DHTML debugging scenarios.Now Featuring dockable floating windows, and an integrated interactive step by step javascript debugging guide. Latest feature added - Local variable Watch tree... |
|
| SplineTech JavaScript HTML Debugger is a unique award-winning javascript debugging tool that enables you to easily edit and debug JavaScript and VBScript inside HTML pages. Client-Side JavaScript, JScript and VBScript debugging languages are fully supported for simple and complex HTML and DHTML debugging scenarios.Now Featuring dockable floating windows, and an intagrated interactive step by step javascript debugging guide. Latest feature added - Local variable Watch tree...
|
|
| Team Remote ASP Debugger is an award-winning ASP debugging tool that enables your team to easily edit and debug ASP code remotely and locally, directly on your production server. JavaScript debugging and VBScript debugging is fully supported for simple and complex local, remote and team remote debugging scenarios.
Now Featuring dockable floating windows, and an intagrated interactive step by step ASP debugging guide.
Team Remote ASP Debugger enables you to:
Debug VBScript error in ASP code,
Debug JavaScript (jscript) error in ASP code,
Expression Evaluation,
Set Breakpoints in ASP,
Step in / out / over,
Variable Watch,
Advanced "GET" and "POST" form debugging
and more.. |
|
 | Award-winning VBS Debugging Tool: Set Breakpoints, Watch Variables, Edit and Debug your VBS code. Vbscript and Javascript Debugging Languages Fully Supported...
|
|
| SplineTech JavaScript HTML Debugger is a unique web development tool that enables you to easily edit and debug JavaScript and VBScript inside HTML pages. Client-Side JavaScript, JScript and VBScript debugging languages are fully supported for simple and complex HTML and DHTML debugging scenarios.Now Featuring dockable floating windows, and an intagrated interactive step by step javascript debugging guide. Latest feature added - Local variable Watch tree... |
|
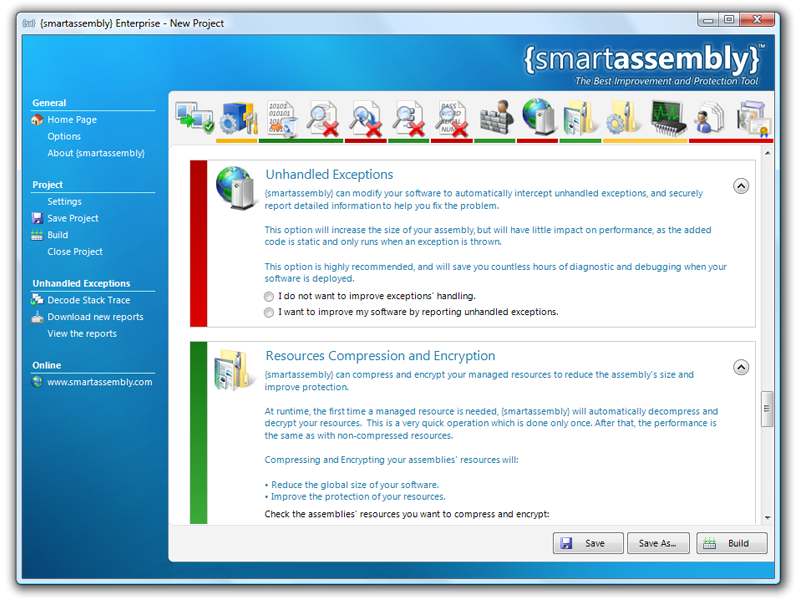 | {smartassembly} is a Software Improvement, Protection & Debugging tool. It will obfuscate your .NET code, protect and optimize your .NET assembly, minimize distribution size, increase performance & add powerful post-deployment debugging capabilities...
|
|
| Exception Wizard is a debugging tool for programmers, created to assist in the debugging of 32-bit Windows applications created with MS VC++ 6.0. Exception Wizard takes an exception address and a project map file and automatically determines where in the source code the exception occurred. Exception Wizard is especially helpful in the following situations: release mode exceptions that cannot be reproduced in debug mode, crashes reported by users (where debugging is not available), and large projects with prohibitively long debug load times. .. |
|
 | AdminPro, the CGI debugging and remote file management tool, lets you upload, download, rename, chmod, delete, open, edit and save files, create, rename and remove directories, and perform two-click CGI debugging - all from your favorite web browser!.. |
|
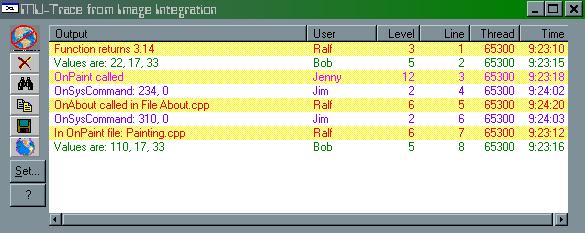 | MU-Trace, the ultimate Multi-User tracing and debugging tool for C/C++ programmers who are working on a bigger project and are working in a group. In comparison with a standard output debugging window MU-Trace has many additional features... |
|
 | Try this integrated development environment (IDE) for Perl with all the necessary tools for writing and debugging your Perl programs. It features multiple CGI scri`pts for editing, running, and debugging; multiple input files; full server simulation; queries created from an internal Web browser or query editor; interactive I/O; directory window; code library; and code templates. !Perl-express allows you to set environment variables used for running and debugging scri`pt. It has a customizable code editor with syntax highlighting, unlimited text size, printing, line numbering, bookmarks, column selection, a search-and-replace engine, multilevel undo/redo operations, and so on. .. |
|
Results in Tags For debugging
| Exception Wizard is a debugging tool for programmers, created to assist in the debugging of 32-bit Windows applications created with MS VC++ 6.0. Exception Wizard takes an exception address and a project map file and automatically determines where in the source code the exception occurred. Exception Wizard is especially helpful in the following situations: release mode exceptions that cannot be reproduced in debug mode, crashes reported by users (where debugging is not available), and large projects with prohibitively long debug load times. .. |
|
| Super 32-bit logging and debugging tool for C and C++ developers.No more slow stepping. Just include logging macros in your source. The library will write info to a logfile and optionally to a real-time scrollable window.Suspend/resume, detect memory leaks, log function-call stack, disable/enable all logging or specific types from any point in your app, hex-dumps, performance measurement and much more!..
|
|
| SplineTech JavaScript HTML Debugger is a unique award-winning javascript debugging tool that enables you to easily edit and debug JavaScript and VBScript inside HTML pages. Client-Side JavaScript, JScript and VBScript debugging languages are fully supported for simple and complex HTML and DHTML debugging scenarios.Now Featuring dockable floating windows, and an intagrated interactive step by step javascript debugging guide. Latest feature added - Local variable Watch tree... |
|
| MU-Trace, the ultimate Multi-User tracing and debugging tool for C/C++ programmers who are working on a bigger project and are working in a group. In comparison with a standard output debugging window MU-Trace has many additional features...
|
|
| This COM-component allows the code disassembling.. |
|
| SplineTech JavaScript Debugger PRO is an award-winning javascript debugging tool that enables you to easily edit and debug JavaScript and VBScript inside HTML pages. Client-Side JavaScript, JScript and VBScript debugging languages are fully supported for simple and complex HTML and DHTML debugging scenarios.Now Featuring dockable floating windows, and an integrated interactive step by step javascript debugging guide. Latest feature added - Local variable Watch tree...
|
|
 | Debugger for PHP. Expert Debugger uses the DBG PHP Debugger and allow to debug scripts via network or on local computer. You can run scripts in step-by-step mode and to trace values of any variables and script output... |
|
| Shows the content of matrices, that are given as two-dimensional arrays. This can be done both in runtime mode and in design mode... |
|
| Unified trace environment consisting of an API plus a trace viewer. A must-have tools for professional developers. All components of all your applications write into the same trace. For development and trouble-shooting at customer sites... |
|
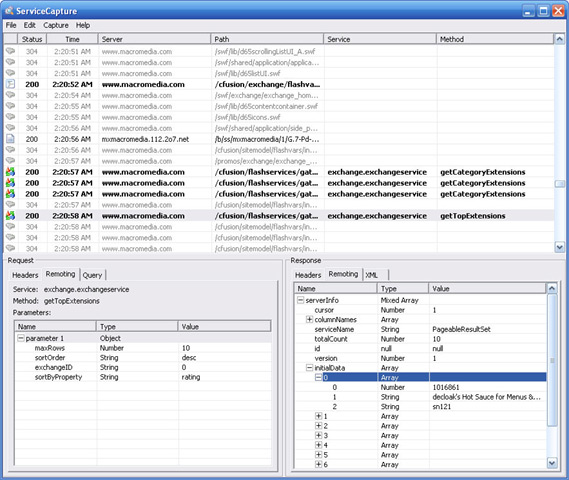 | ServiceCapture runs on your PC and captures all HTTP traffic sent from your browser. It is designed to help Rich Internet Application (RIA) developers in the debugging, analysis, and testing of their applications... |
|
Related search : ogging and,splinetech javascript,debugger splinetech javascriptjavascript debugger splinetechsplinetech javascript debugger,debugger projavascript debuggersplinetech javascript,splinetech javascript debuggerpro splinetech javascriptexpert debugger,deOrder by Related
- New Release
- Rate
debugging support -
jit debugging -
code debugging -
debugging tool -
remote debugging -
|
|